What is Spend Analysis?
Spend Analysis is the process by which procurement collects, cleanses, classifies & analyzes historical spending for products and services.
This data is collected & aggregated from across the entire organization, & categorized by users, suppliers, item categories, business units, geographies, internal corporate divisions, etc.
This guide to spend analysis can help large enterprises to identify opportunities to reduce costs, improve efficiency, and mitigate risks.
This involves how, what and where money is spent.
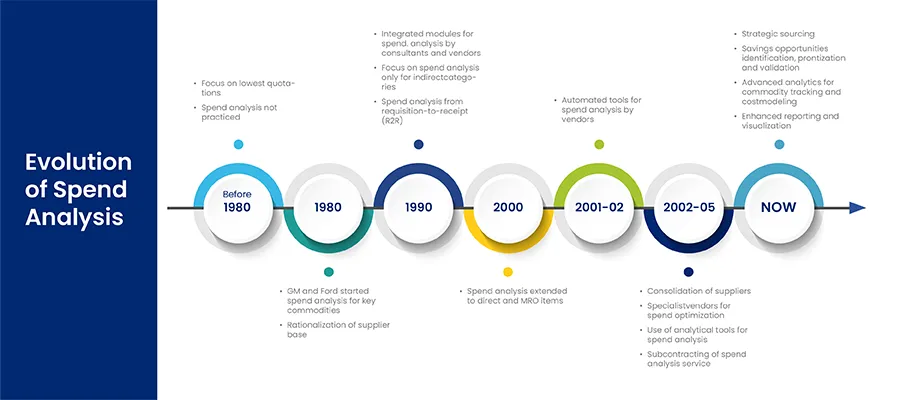
The evolution of spend analysis.
Over the last few decades, the procurement department within many organizations has transitioned from a primarily logistical function (that solely executes purchases upon budget-holders’ requests) to a more strategic function that guides senior leaders and budget holders in maximizing value for the organization’s dollar.
This involves establishing within the procurement department a proactive process in parallel with the still-necessary reactive process of responding to budget-holder requests.
Spend Analysis is one of the key tools that procurement organizations use in this parallel process to proactively identify opportunities to optimize their organizations.
Why Spend Analysis is Important?
In many big organizations, purchasing has historically been decentralized, making it very difficult to get a single, consolidated, consistent dataset of enterprise-wise spend across different, geographies, business units & departments.
- Data from different geographies often have cryptic, abbreviated or miss-spelt text in item descriptions
- Different languages & currencies
- Inconsistent category coding or supplier naming conventions,
- Incorrect/Inconsistent/Duplicate GL codes for same item across different geographies
- Ineffective/Inconsistent classification taxonomy
- Cumbersome, labor-intensive, error-prone, Manual/Rules-based classification that is most common, results in low quality analytics as low-quality data is going in.
Read our blog on: Procurement analysis is empowering the future of procurement.
How to do Spend Analysis?
Like any other process the first step in the process is to understand objective. What do you want to achieve with your spend analysis? Are you looking to reduce costs, improve efficiency, or mitigate risks? Once you know your objectives, you can tailor the rest of the process accordingly. This comprehensive guide to spend analysis going to answer all your queries.
Steps in Spend Analysis Process
- Identify all the sources available for your spend data, from all of your departments, plants and business units. This includes accounts payable, general ledger, P-Card, eProcurement systems, etc.
- Gather and consolidate all of your spend data into one central database. This can be difficult if your data is in different formats, different languages and different currencies.
- Cleanse your data. This includes finding and correcting errors in descriptions and transactions, as well as standardizing the spend data for easy viewing.
- Normalize, your suppliers for better supplier management. Purchases made from IBM, IBM Corp., or Cognos should all be grouped together, since they’re the same supplier.
- Categorize your spend. Whether you use UNSPSC, eClass, or your own company-specific categories, you need to be able to determine where your money is being spent. Office supplies, marketing travel, legal, direct and indirect spend should all be categorized appropriately.
- Analyze your spend data. Ensure that you have negotiated the best contract terms per supplier, now that all of your spend is identified per supplier. Ensure that all of your buyers are purchasing from preferred suppliers. Reduce the number of suppliers per category.
- Repeat. Performing a spend analysis once is a great start to identifying savings, however you need to continually update your data to ensure that contract terms are being adhered to, that buyers are purchasing from preferred suppliers and that savings opportunities are being identified.
Here is a 4c approach to go about your spend analysis.
Spend Analysis Example
Let’s explore a practical example of how spend analysis can significantly benefit an organization. Imagine a mid-sized manufacturing company facing rising costs and seeking to improve its procurement strategy. The company’s procurement team decides to implement a spend analysis to uncover potential savings and enhance efficiency.
Step 1: Data Collection
The team begins by collecting data from various sources, including purchase orders, invoices, and supplier contracts. This data encompasses multiple categories, such as raw materials, office supplies, and logistics.
Step 2: Data Cleansing and Classification
Next, the team cleanses the data to ensure accuracy and consistency. Duplicate entries, errors, and inconsistencies are addressed. The data is then classified into categories and subcategories, making it easier to analyze and compare.
Step 3: Spend Analysis
With clean and classified data, the team uses spend analysis tools to generate reports and visualizations. They identify trends, such as which categories have the highest spend and which suppliers are used most frequently. For instance, they discover that 40% of their spending on raw materials is concentrated with three suppliers.
Step 4: Insights and Opportunities
The analysis reveals several opportunities for cost savings. The team notices that consolidating orders with preferred suppliers could lead to volume discounts. They also identify a few suppliers with higher prices compared to others offering similar quality products.
Step 5: Actionable Strategies
Based on these insights, the company negotiates better terms with key suppliers, consolidates orders, and explores alternative suppliers for better rates. As a result, they achieve a 15% reduction in procurement costs within the first year.
What will Spend Analysis help you achieve?
The spend analysis process will help you and your team-
- Deliver Savings : Right now everyone is being asked to do more with less. You’re being asked to deliver savings while still providing your stakeholders (internal customers and your constituents) with the same goods and services.There is only so much negotiation you can do with your vendors for the best possible deal. Spend Analysis gives you great insight over your spend data and can help you identify opportunities you didn’t know existed.
- Improve Processes: Spend Analysis data will allow you to make an informed decision on how processes within your organization could be improved.Whether this be the implementation of an eProcurement System, better use of PCards or consolidating invoices with individual suppliers, spend analysis data help identify these opportunities.
- Managing Maverick Spend: Everyone puts contracts in place, but after signature, they tend to get relegated to a filing cabinet or electronic record system, not to be looked at until there is a problem, or the contract is about to expire.Spend analysis will allow you to track these and identify spend with non-contracted vendors in categories where a contract is available or the categories of spend where there may be too many suppliers and no contract in place. Read here: Five Ways to take Control of Maverick Spend!
- Managing Supplier Relationship: Generally, your vendors will know more about how much and on what you spend with them than you will. Spend analysis can help to correct that imbalance and in some ways.When it comes time to negotiate a new contract with a vendor, having done a comprehensive spend analysis will give you more information about your spend with that specific vendor and also can provide you with insight into how much you are spending with that vendor’s competitors which is information your vendor doesn’t have. Read here: A Walkthrough of Vendor Spend Analysis: Enhancing Supplier Management
- Manage Risk: In some cases, the vendor may steadily become overly reliant on your organization for their annual revenue. Too much spend with one vendor can create risk in two ways. Firstly, if they are dependent on your spend and you make the business decision to move your spend away from this vendor, they could potentially go out of business causing a public relations issue, even if the procurement decision in isolation was the correct one which may amount to negative feedback or publicity for your company.
Secondly, if you are too dependent on one vendor and that vendor goes business for other reasons, your organization could be left without critical goods or services that you need.
Read here: A Comprehensive Guide to Supplier Risk Management - Source More Locally: Spend data enriched with geographic information enables you to understand how much you spend locally now, and then take steps accordingly.All too often, public procurement teams are criticized for not spending enough with local businesses, without anyone actually knowing how much is spent with local businesses or on what.
Whatever your position on preferences or set aides, having accurate information in hand can be instrumental in establishing your position as the credible one.
But Manual Spend Analysis has it’s own challenges
Inconsistent spend records:
- Disparate data sources
- Incongruent supplier naming conventions
- Inaccurate and incomplete data
- Inability to extract data
- Different languages at global sites
Inability to Identify Savings Opportunities:
- Time consuming process of identifying savings from plethora of reports
- Lack of knowledge of category trends or market information
Faulty Reporting:
- Multiple reporting standards
- Inadequate reporting abilities
(mostly supplier or class level)
Unreliable Classification:
- Multiple GL codes for same item
- Ineffective classification schema
- Labor intensive classification process
- Insufficient commodity expertise
What does the Market Need:
- Artificial Intelligence based classification
- Customized hybrid taxonomy creation
- Flexible data extraction capabilities
- Intuitive reports and dashboards for granular level spends visibility
- Intuitive data visualization for analysis
- Automated savings opportunity identification
Importance of Global Spend Analysis
Whenever you narrow the scope of your analysis to a subdivision of the organization, it’s important to recognize that the spending associated with that subdivision may not be representative of the organization.
Therefore, the priority action items you identify for improving social, environmental, and economic performance of that subdivision’s spending may not be the most strategic actions for improving the performance of the entire organization’s spending.
Some Key Terms to Understand
Direct v/s Indirect Spend
Direct Procurement: Refers to purchases of goods and services that are directly incorporated into a product being manufactured. Examples include raw materials, subcontracted manufacturing services, components, hardware, etc.
Read more: A Guide to Direct Procurement in the Digital Age
- Indirect spend has been carefully managed for years & on average, direct spend savings potential is only 3%. Even if direct spend is 50% of total spend, that indicates that the total savings potential in direct spend is a mere 1.5%.
- Indirect Procurement: Refers to purchases of goods and services that are not directly incorporated into a product being manufactured. Examples include computers, safety goggles, printed forms, office supplies, janitorial services, equipment, furniture, etc.
- If indirect spend is 20% of revenue, and the savings opportunity is 10%, the organization can quickly shave 2% off the top by tackling indirect spend.
Direct v/s Indirect Spend (Procurement Perspective):
- Indirect spend areas provide higher improvement potential that is often easier to realize.
- This non-strategic spend is easy to overlook.
- Lack of oversight often results in these categories not being managed in a professional manner, resulting in poor visibility and control.
- This can be very costly to a company as indirect spend typically accounts for 13.5% to 22% of revenue, depending on the industry.
- On average, 12% of negotiated savings on indirect spend categories is lost because contracted rates were not adhered to.
- World-class Companies have 45% lower indirect procurement process costs than its peers, in addition to lower product and service costs.
Guide for maximum savings from indirect spend management
Benefits of Automated Spend Analysis:
Advanced spend analytics can help with fast, flexible, repeatable spend data extraction. While it does that there are multiple other benefits of automating the process of spend analysis
- Global spend visibility.
- Accurate, detailed, consistent & timely views of spending. – Spend views that keep pace with business & market changes.
- Spend views that keep pace with business & market changes.
- Generate comprehensive, exportable reports with minimal effort.
- Quick snapshot & easy access to relevant information.
- Consistent alignment of work activities with top line business objectives.
- Improved data quality & minimized maverick spend.
- Quick & easy opportunity identification & prioritization.
- Effortless integration of spend with other procurement modules, ERPs & external market information.
Read our blog on: How Automated Spend Analysis Revolutionizes Procurement Strategies
Some Additional Tips to Make Spend Analysis Successful
- Get alignment with stakeholders: Support from senior leadership can decide the success of spend analysis in organization. Kick offs to make everyone understand the objective of spend analysis can help get org level alignment for the goals.
- Ensure the data quality is high: The output of your spend analysis results will depend on the what quality of data has been processed. Make sure that your data is accurate, complete, and up-to-date.
- Use innovative tools for accurate results: An AI powered spend analysis tool can help you to classify data with maximum accuracy. It can also help automate many of the manual operational tasks which can help you save time and effort.
- Drive action from the insights: Don’t let this data keep sitting on the table. Make sure you are taking appropriate actions. Drive on ground results by acting on the recommendations to reduce costs, improve efficiency, and mitigate risks.
- Zycus Spend Analysis Software: Zycus Spend Analytics completely transforms spend analysis by easily mining spend opportunities, minimizing maverick spend and identifying savings based on out-of-the-box savings strategies.
Zycus Spend Analysis Software
Zycus Spend Analytics completely transforms spend analysis by easily mining spend opportunities, minimizing maverick spend and identifying savings based on out-of-the-box savings strategies. Book a demo today to get a clear understanding.
Related reads:
- Smart Spend Analysis: A bird’s eye view
- Advanced Spend Analysis: A new offering for your procurement initiatives
- Transcending Spend Analysis: Supplier and Commodity information as key drivers to spend management
- How Automated Spend Analysis Revolutionizes Procurement Strategies
- Press release – Global resource-based industrial group gains spend visibility with Zycus
- Press release – Global procurement leaders Horizon 2015 meet up will soon convene in spectacular setting on Lake Oconee, Ga.
- Press Release- Global Outdoor Advertising Giant Partners with Zycus for Spend Analysis and Reporting
- Press Release – Leading Industrial Solution Provider Joins Hands with Zycus for Spend Analysis


